The true power of Power BI
With the surge of big data the last few years, there has been a lot of conversation happening around the useful visualisation of data. Data visualisation improves our complex sense-making and pattern recognition abilities. For data to be useful, it has to be collected, organised and presented in such a way that new insights can be discovered from it at first glance.
Achieve smarter insights, faster with Power BI
“Power BI offers data preparation, data discovery and interactive dashboards via a single design tool” – Gartner.com
Microsoft describes their self-service Power BI technology as “a suite of business analytics tools to analyze data and share insights.“ A range of data sets can be imported into Power BI, manually or automatically, ranging from excel spreadsheets, on-premise data sources, Hadoop data sets, streaming data and other cloud-based services (see all 59 data sources). This makes Power BI useful for various departments, from finance to sales and operations.
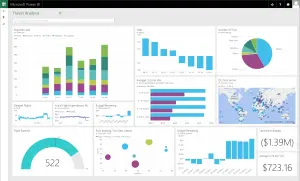
One can quickly create custom dashboards with interactive reports that showcases an entire business’ key metrics to key stakeholders and decision-makers. You choose the types of graphs you want to use, ranging from the pie charts and line graphs to geographic hot maps. The graphs from these dashboards can even be embedded into mobile apps, such as those built with the powerful Azure App Service.
Power BI is available as a basic, free online tool or paid-for Pro User tool, ranging from Microsoft Power BI Desktop, Microsoft Power BI Mobile and Microsoft Power Bi Gateway.
Other interested articles to read around Business Intelligence: Magic Quadrant for Business Intelligence and Analytics Platforms(gartner.com)